
Description
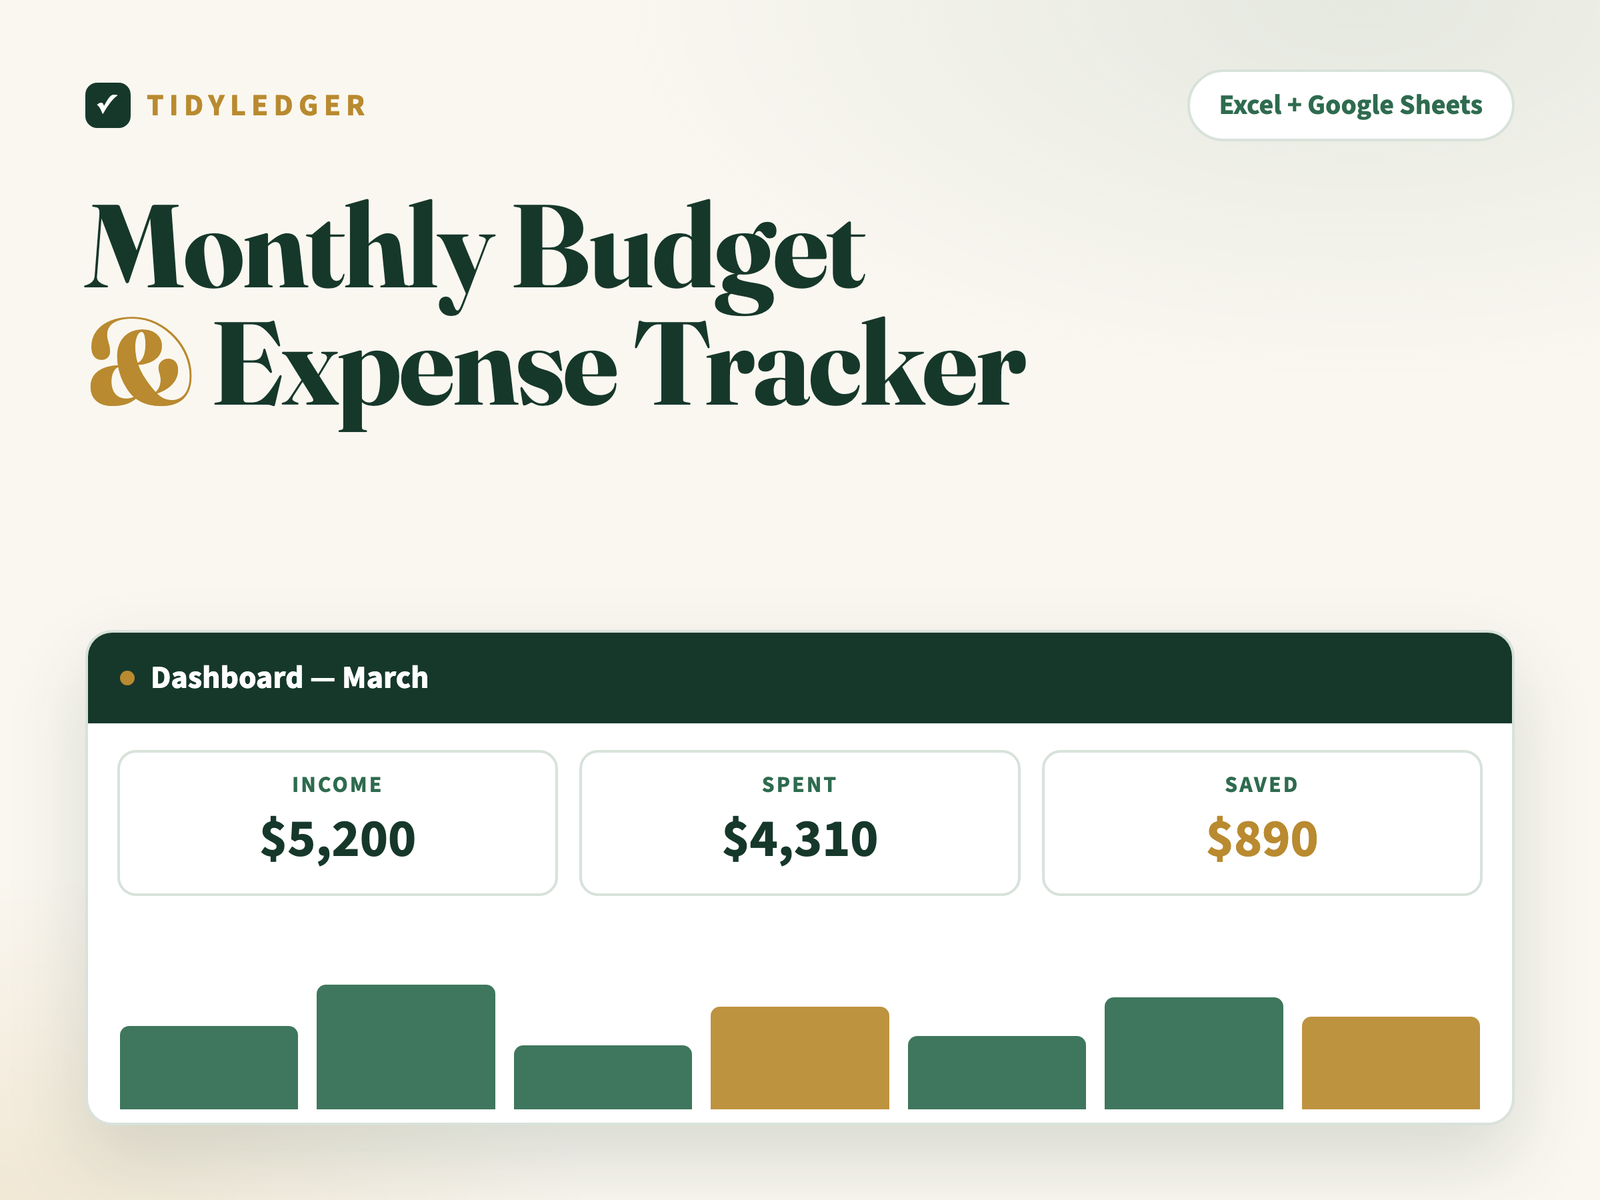
The tracker for people who quit trackers: logging a purchase takes about 30 seconds, and the dashboard does all the thinking — where it went, what’s left, and whether the plan is slipping.
Inside the template — tab by tab
- Start Here — two-minute setup for Excel or Google Sheets.
- Categories — 8 groups, 24 categories (2 income + 22 spending) with monthly budgets. The totals show your planned savings before the month starts.
- Transactions — a 500-row log: date, description, category dropdown, amount. The month tag is automatic — no sorting, no formulas to touch.
- Budget Grid — your actual spending appears in a 24-category × 12-month grid, filled by formulas from the log. Year-to-date per category, plus a “vs plan YTD” column (budget × months elapsed − actual) that turns red exactly where the plan is slipping.
- Dashboard — pick any month from a dropdown: income, spent, saved and left-in-budget, spending by group for that month and year-to-date, and three live charts (group bar, 12-month trend line, year doughnut).
Why it works
Most budgets die of friction. Here the only daily job is a one-line entry; the grid, the red flags and the charts update themselves. At year-end, save a copy, clear the log, and your whole setup carries over.
The details
- Format: Excel (.xlsx) — imports into free Google Sheets in two clicks (step-by-step instructions included)
- In your download: the spreadsheet, a Quick-Start PDF, a README and the personal-use license
- Delivery: instant download after checkout plus an email link — unlimited re-downloads, links never expire
- Works on: Excel 2016 or newer (Windows & Mac), Excel for the web, and Google Sheets. No macros, nothing to install.
- One rule: type only in white cells — green-tinted cells calculate themselves
- Guarantee: 30-day fix-or-refund. Reply to your order email; a human answers within 24 hours.
Reviews
There are no reviews yet.